Any challenge in life is important to be objective in order to be fixed or to be proven fixed, in software performance we can do that through some metrics to measure specific things to prove that there is a performance problem and insure that it is fixed later, in this article we will continue what we started in the performance series by answering some questions like how fast is fast?, what to measure for web perf?, and what are the types of measuring tools?.

Users might not notice
As we talk in the first article about the motivation behind taking performance seriously, we need to make the web fast for people with low-end devices and slow connections, but when can we say “well, this is enough perf optimization?” that’s a good question and to answer that we need to ask another question: Is perf about being fast only? short answer No
Long answer it depends, we have multiple indicators that says if our application is performant enough or not, Imagine that you are building an application for some iPhone users and the JS bundle size is for example ~2MB and we will assume as well that they are connected to fast internet, do you thing it worth it to optimize the bundle size in this case to be about ~1.5MB? would the iphone users notice? I don’t think so, in this case in my opinion you are wasting time while the user wouldn’t feel a difference in performance
From here you know that it depends on the end user device and the internet connection maybe, it is not always needed to go far with optimization
How fast is fast?
In other words when to stop the optimization process and say that is good enough, well you need to have the following information first:
- The common devices that the majority of your website visitors are using
- What is the common connection condition for visitors
- What are the device sizes that they are using

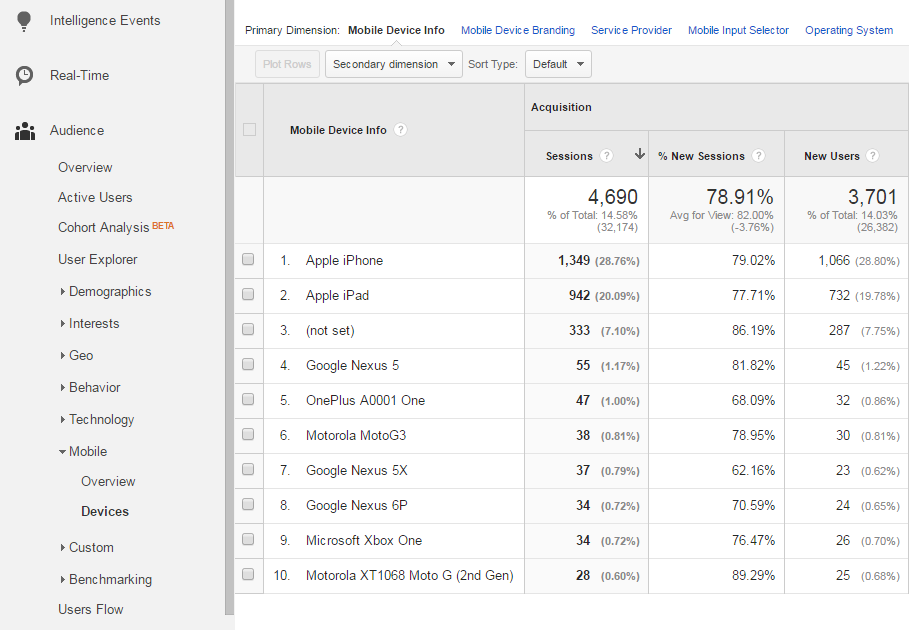
Since it is all about the user experience, after you learn about the above stuff you will be able to set your optimization boundaries, to gather all these information you have several ways to do so, using analytics tools like Google Analytics 🔗 for example as in the screenshot above, these information are very important to optimize only when you really have to, and not to waste time optimize something that users cannot notice
What to measure for performance?
After you know your user you can start testing your application simulating the worst case of your users and keep measuring until you find good performant application for the least device segment of your users group and for the least internet connection condition as well
If you want to make sure that your results after optimization is up to the standards, you can use some metrics provided based on long user researches like the Core Web Vitals 🔗, which is simply an initiative by Google to enhance the overall user experience of the web
Core Web Vitals

In 2020 google launched this initiative and started with measuring only 3 new metrics for user experience:
- LCP (Largest Contentful Paint) for the first load experience, and is supposed to be within the threshold in the figure above below
2.5sis preferred and not above4sis poor and needs an action - FID (First Input Delay) for the interactivity of the page, it measures the time your website takes to respond to the user input which can be a click, scroll, input, …etc, you need to keep it below
100ms - CLS (Cumulative Layout Shift) for the layout stability, if some elements in the page appear suddenly after the page load and shifted all elements down, that it an unstable layout and can be measured using this metric, it is better to make as
close to zeroas possible
If you could successfully make your website pass these metrics and keep at least 75% of the pages of their websites within the threshold mentioned you can say this is fast and performant enough.
What is so cool about these new metrics is that they are for the benefits of the user, if the website creators don’t pay attention to enhance them they are losing SEO ranking which means losing online business, as these metrics are contributing now to the SEO ranking, and that was smart from Google to force it (their game their rules)
Types of measuring tools?
Now after we learned what we need to measure, it is time to learn how can we measure it, there are 2 types of measuring tools:
1. Lab testing (aka sympathy testing)
After you know your user very well as explained earlier, you can use some tools to simulate the user situation by throttling the CPU for example to match as close as possible to least user device CPU, it is very nice to use this in the development mode to set a baseline for the performance state before launching
You can measure the LCP and the CLS but cannot measure the FID as it requires a real user interaction, but you can depend on another metric here that might reflect the user input delay as well which is TBT (Total Blocking Time).
⚙️ Tools
- Light house 🔗 [Free]: the most common lab perf testing ever, as it is by your hand in your chrome devtools, very fast and gives you some audits to follow so you can enhance your page speed

-
PageSpeed insights 🔗 [Free]: a great tool by chrome team, it measures core web vitals on desktop and mobile and also gives you some opportunities to enhance perf.
-
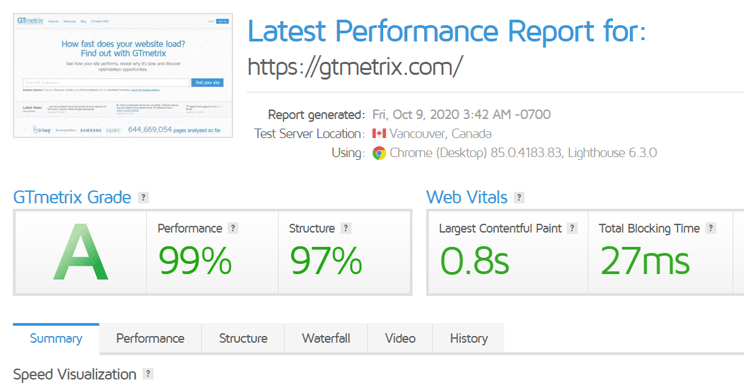
GTmetrix 🔗 [Free]: another awesome site for measuring the web vitals on a random real machine somewhere in the world, and gives you lab results

- more…
There are some more tools that can be used but those are the ones that I constantly use and are free.
Note: all these lab testing tools and the other ones gives you some recommendations and audit for perf, SEO, A11y, and more if you follow the advices there you can enhance your application drastically
2. RUM testing
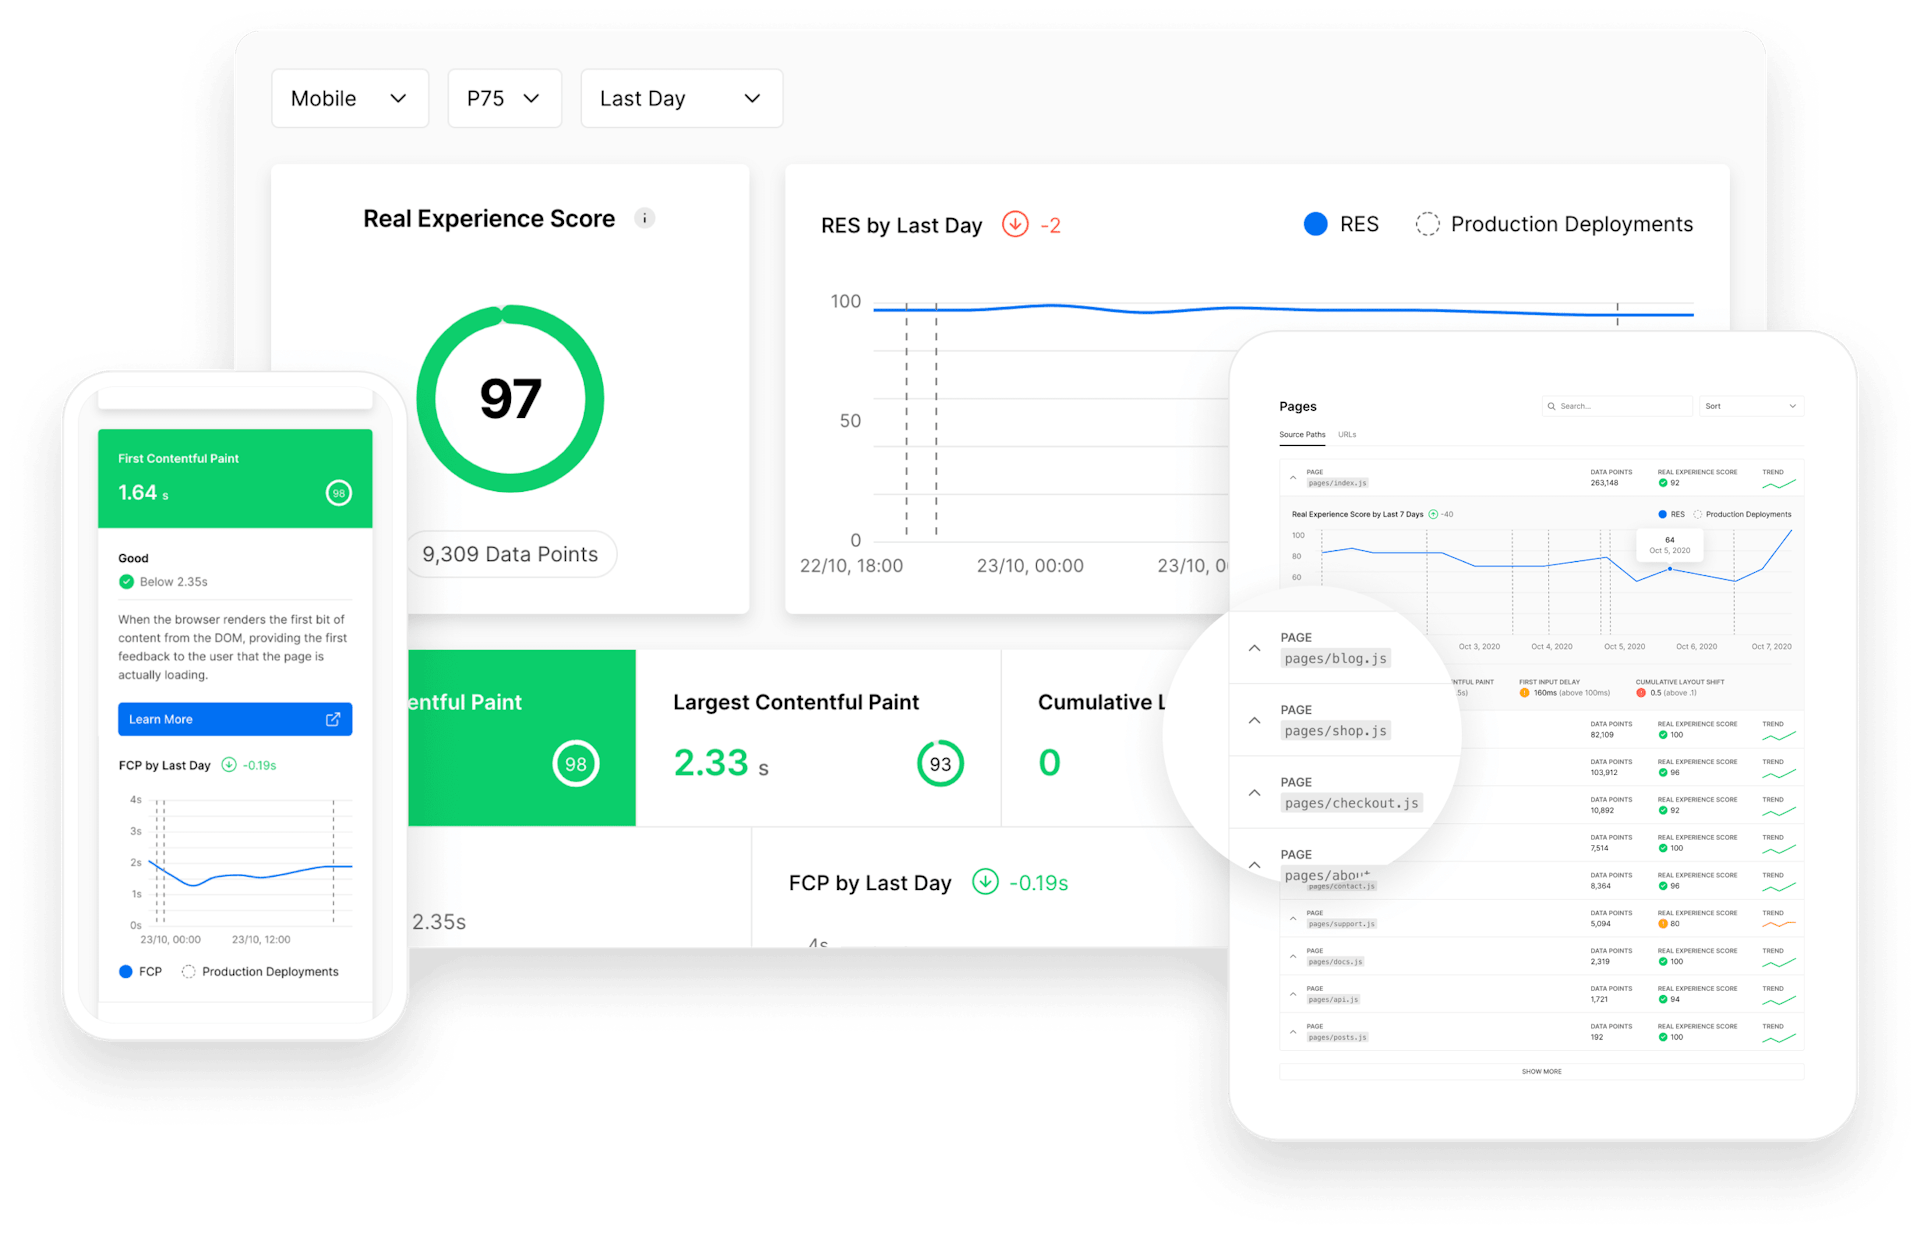
Another way of measuring perf, RUM is an abbr for Real User Monitoring, which means that you are using a real monitored data based on real user experience, of course this is way more accurate, it is measuring how the real user experiencing your web app with the delays, errors, layout shifts, no simulation, and no assumptions.
You got here detailed information about the pages performance as the user experience them, including LCP, CLS, and FID
This is highly recommended when you need something to depend on before the decision of perf optimization, better than the lab testing which might be misleading sometimes
⚙️ Tools
-
CrUX 🔗 [Free]: Chrome User Experience Report on Data Studio, it is very nice and gives great reports over time as well, for both desktop and mobile.
-
CoreWebVitals lib 🔗 [Free]: a library created by the chrome team and is very easy to use, just decide your own logging way either locally or online log service, and btw this comes out of the box right now with create react app.
import { getCLS, getFID, getLCP } from 'web-vitals';
getCLS(console.log);
getFID(console.log);
getLCP(console.log);- Vercel Analytics 🔗 [Free/Premium]: really good tools, I switched recently to Vercel for hosting this blog, and it is free to enable the analytics for hobby projects plan, but premium for teams and businesses.

- Calibre 🔗 [Premium]: it is really a great tool with a great UI, It is a premium tool with free trial however they have a free page for lab testing as well, here is for my website a report 🔗 for core web vitals
- mPulse 🔗 [Premium]: that is a tool from the famous security Akamai 🔗 tools, based on reviews from some friends they liked it so much and it has also some analytics like google analytics alongside with the core web vitals which makes it more comprehensive, and it is premium with a free trial
- more…
Also for RUM testing, you can find more tools online and produced every day to server the same thing, giving the most accurate web performance reports for real user experience.
Conclusion
In this article we’ve learned about the way to measure web performance, what to measure and how to measure it, and to what extend you should optimize performance, and finally some tools that you can adopt today
Performance is an on-going journey, the more you add features the more you are adding more challenges to performance, by measuring constantly you can see what affects performance and eliminate it early.
Tot ziens 👋